Sysomos Product Redesign
Redesigning a complex social media analytics platform to improve usability and user engagement while maintaining analytical depth.
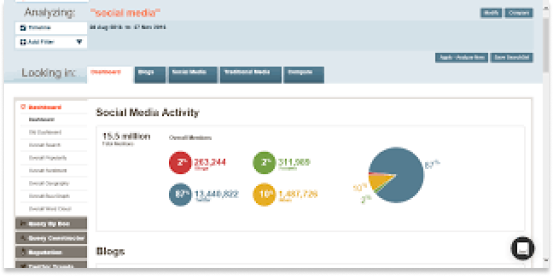
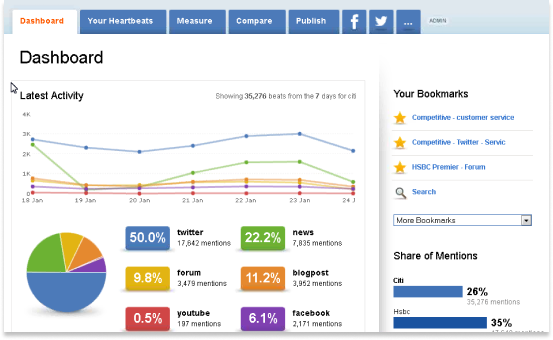
I was tasked with building and leading a team to redesign the platform offerings for MAP and Heartbeat. MAP serves as a comprehensive social media search engine, essentially "Google for social media," while Heartbeat functions as a social media analytics platform, similar to "Google Analytics for social media."
UNIFY THEIR FLAGSHIP MAP AND HEARTBEAT PRODUCTS INTO A SINGLE PRODUCT OFFERING WHILE MINIMIZING USER DISRUPTION
This was a 6-month contract where I served as both product manager and lead UX designer. I immediately began hiring external developers to augment our small development team. As the project progressed, I brought on a UI designer and UX researcher to strengthen our design capabilities. Quality assurance was handled in-house throughout the project.
Upfront Technical Challenges
Spaghetti Code
The front end was mixed in with the backend. We knew an API layer would need to be introduced to abstract the front end from the platform.
Expensive Visualizations
Visualizations were custom made and expensive to build. We knew that a visualization library would be needed to scale the product.
Data Volume
Having social feeds from sources like Twitter where we had the full 'fire hose', we knew that the ability to quickly manage large data sets would be key to success.
Understanding Our Users
Through a number of customer discovery interviews, and continuous discussions with the Sysomos customer support team, a few primary user personas appeared.
Brand Manager
These individuals, typically at smaller organizations, were responsible for the entire brand domain including social.
Social Media Manager
These individuals were more common and responsible for the social media strategy.
Social Data Scientist
Only found in larger organizations, these individuals focused heavily on the data and search query governance.
What Our Users Said
"Writing a Boolean query is difficult and so easy to forget a bracket which can be so frustrating to find"— Social Media Manager
"I can spend up to an hour creating my own weekly reports because the Sysomos ones are ugly"— Social Media Manager
"Why can't I create a Heartbeat from a MAP query?"— Data Scientist
"I wish I could be alerted in some way when one of my Heartbeats spikes or drops"— Social Media Manager
"I wish I had the ability to configure a Heartbeat in a dashboard so I could organize the information"— Brand Manager
Formulating a Plan
Product Unification
The primary task was to bring the two flagship products together. Starting with this foundational step was key.
Query Construction
Simplifying query construction was prioritized second simply because of the scale of the challenge. Data reporting was better understood, and less of a bottle neck for the team.
Data Reporting
Enabling social media professionals to quickly report on their brand had a huge opportunity to make a big impact on customers workflow.
Defining the Platform Architecture
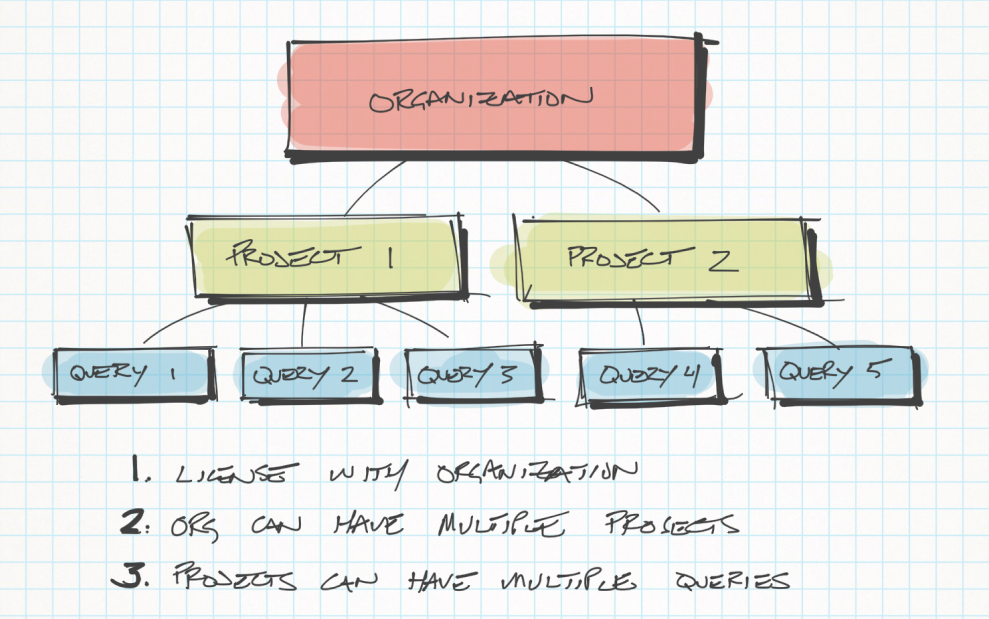
The architecture needed to be flexible enough for large organizations to manage several brands. We landed on a structure that had projects map to an organization, and query objects map to projects. Smaller organizations would have a single project, large organizations would have several, with several query objects mapping to each. This design proved to be the most flexible for the majority of our customers.
Understanding the User Journey
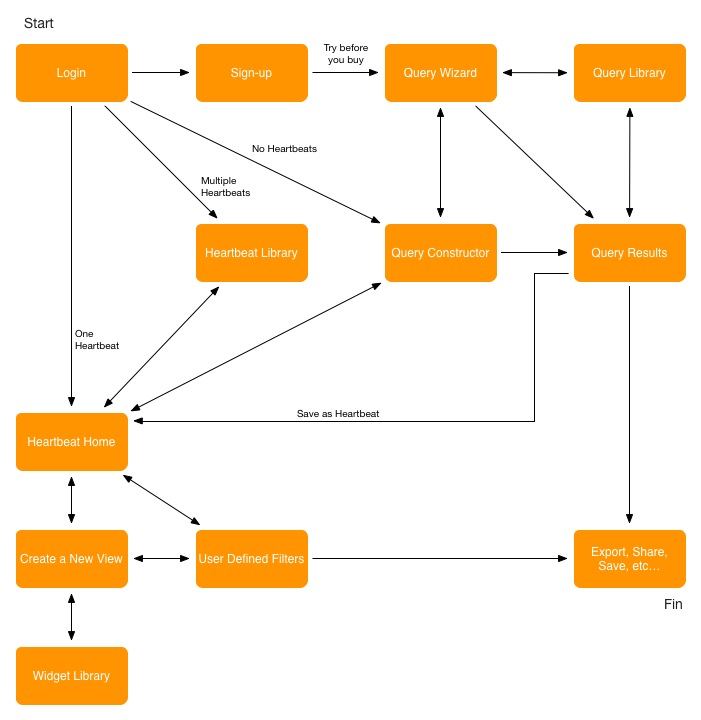
Leveraging a JTBD mindset, a flow diagram was created based on customer & CS interviews that described the consistent workflow.
Mapping Journey to Navigation
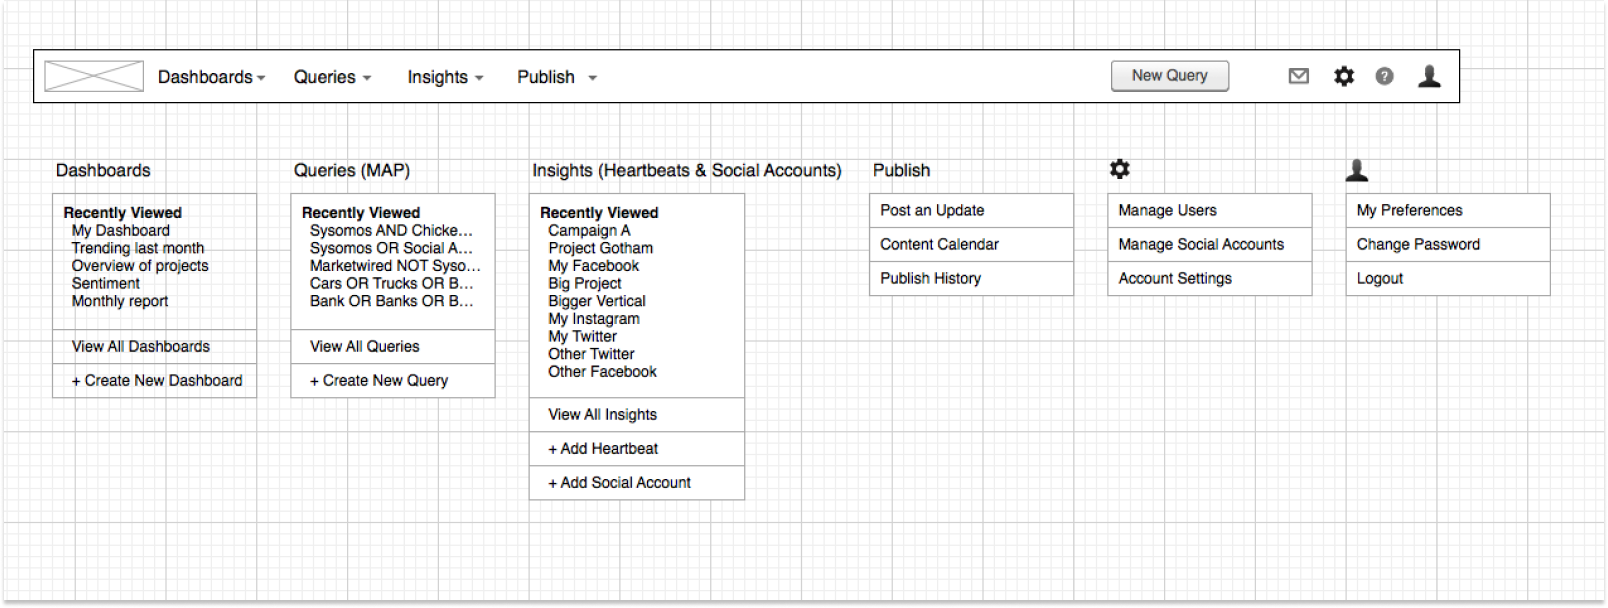
At this point I had established the Sysomos Advisory Group on Facebook. This enabled me access to several of our top customers in order to get quick feedback on navigation concepts. Using these interactions and a few card sorting exercises with the CS team, we landed on a navigation that was easily understandable and saved time.
Simplifying Query Construction
Both MAP and Heartbeat leveraged Boolean queries to return search results. As such a critical part of the application, the feature was severely neglected as essentially a text modal. Through interviews the importance of query construction was obvious. The fact that they're difficult and time consuming to make was also clear.
Query Constructor Concept Discovery
Simple Query
How might we make creating a query so easy that even a social media intern could create a first draft and get meaningful insights?
Component Library
How might we enable query creators to work faster by giving them a toolbox of query elements that can be easily integrated?
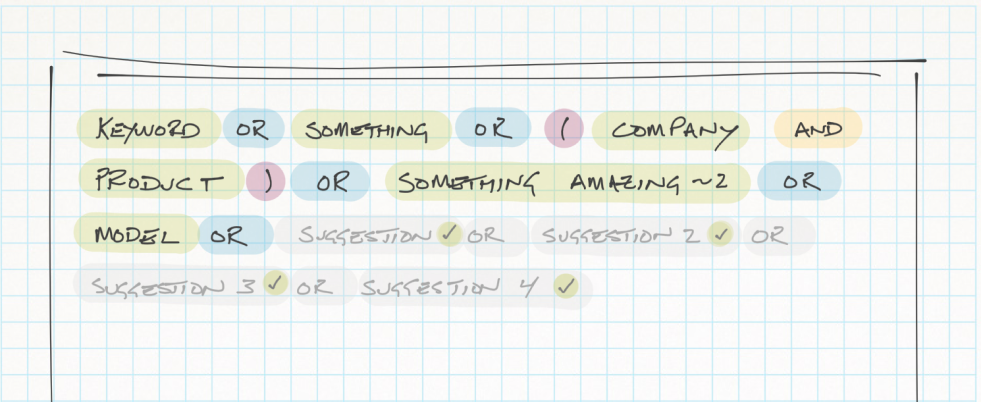
Advanced Query
How might we augment query construction such that we can make advanced query constructing faster and less prone to errors?
Query Constructor Concepts
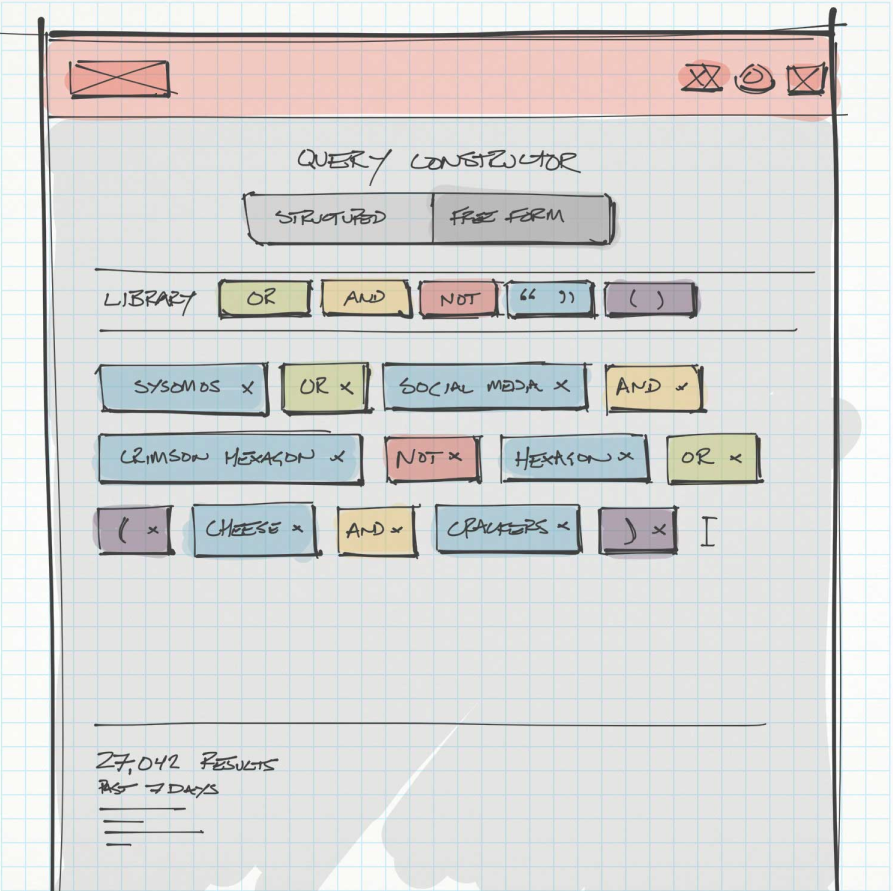
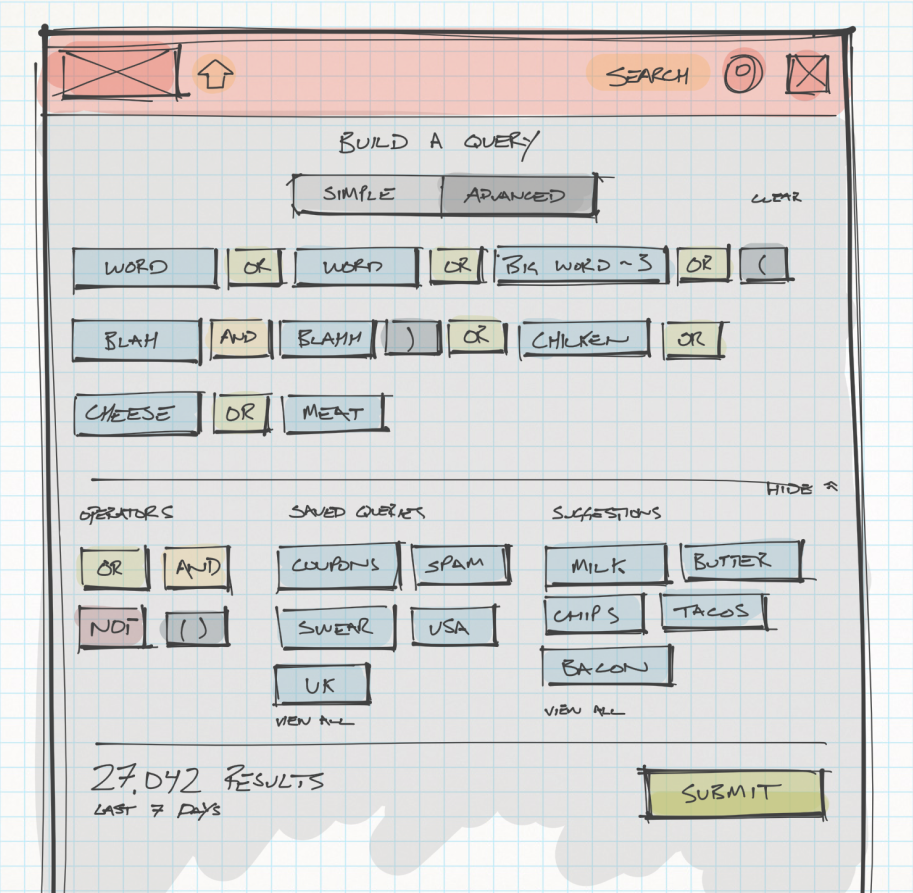
Advanced Query Sketches
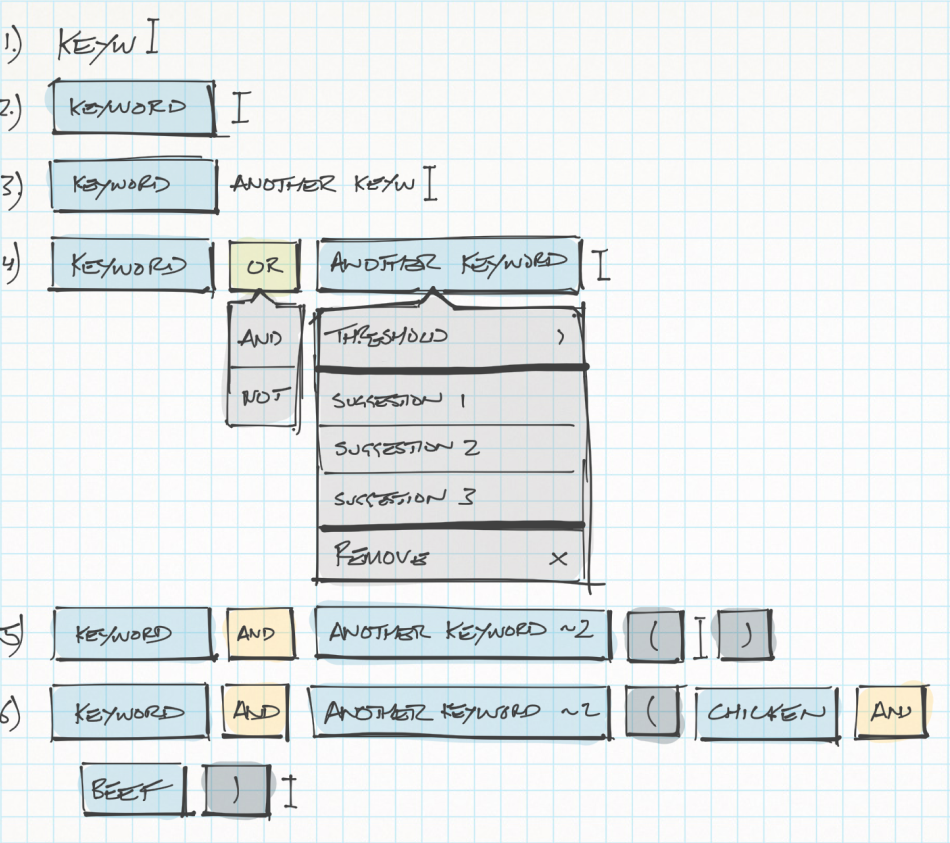
Finding the Simple Query
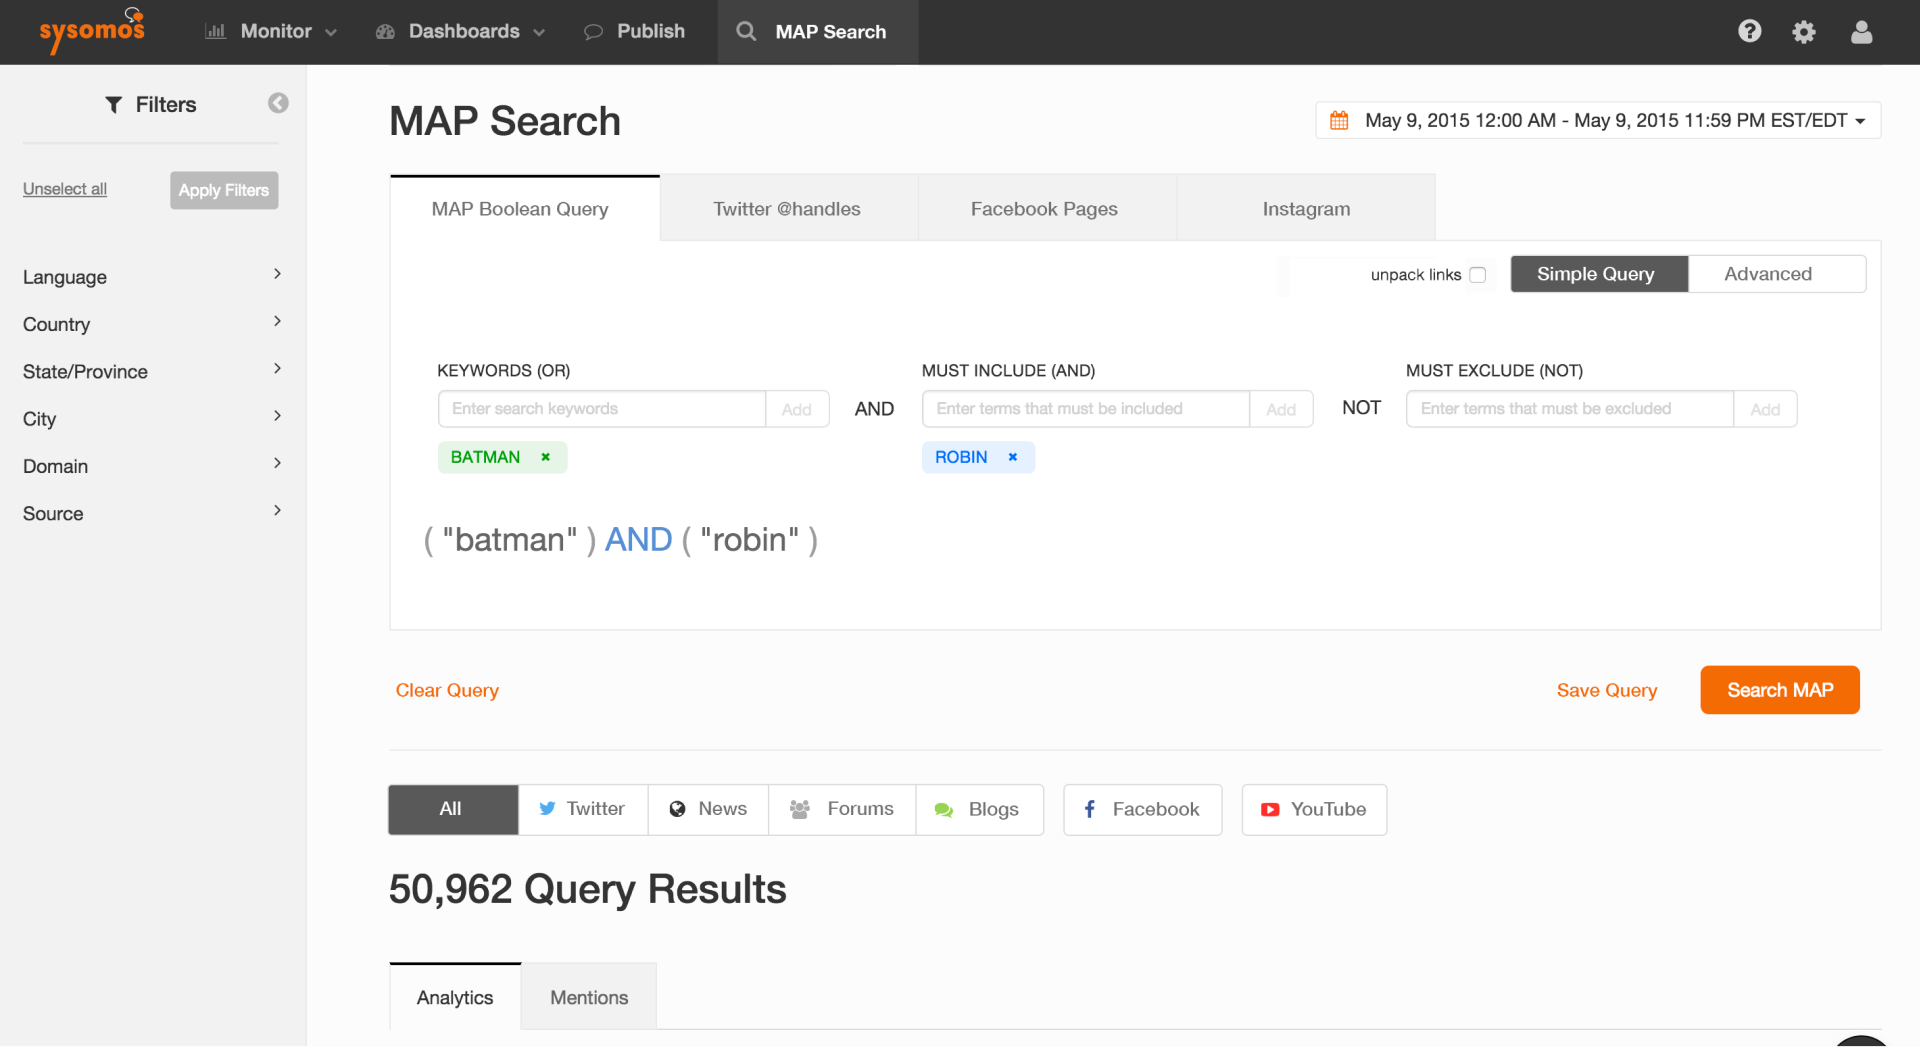
Through "paper" prototyping with advisory customers and CS teammates, the simple query was created. A quick way to organize keywords into 3 groups that automatically creates the Boolean syntax. Improving accessibility of Boolean queries for novice users would have the largest overall impact to our users.
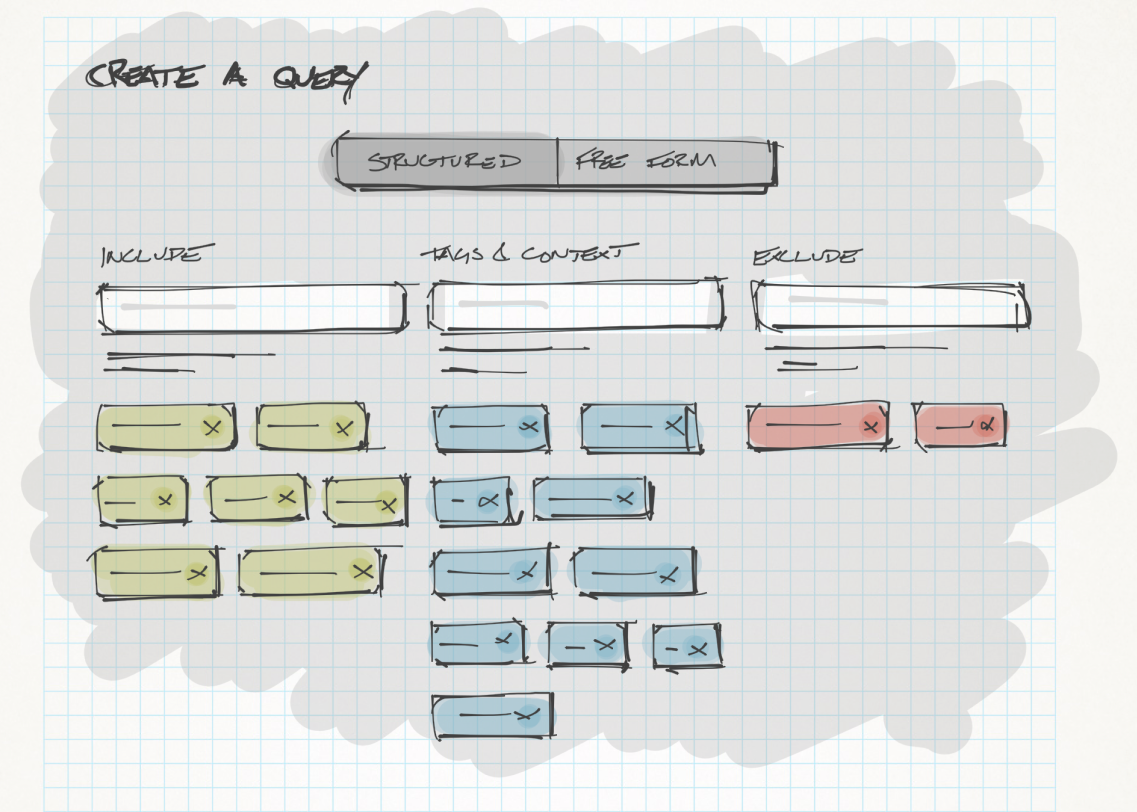
Concept validation was done with higher fidelity wires leveraging different screen states in order to perform basic printed usability testing.

This was integrated into the product as the starting point for all new queries for both MAP and Heartbeat products. The query constructor proved an effective way for all users to start writing queries.
Learnings
Simple Query
Successfully implemented and adopted by users, proving the value of accessibility-focused design.
Component Library
Identified as a future opportunity where governance and change management were uncovered as important unmet needs.
Advanced Query
Identified as a future opportunity where governance and change management were uncovered as important unmet needs.
Improving Data Analytics
Once the application architecture was established, and all users for both products had confidence jumping in and creating a search query, the focus turned to improving how users could analyze and derive insights from their data.
Social Reporting Concept Discovery
Visualizations
How might we improve the visual quality of visualizations so that there is confidence adding them to reports?
Dashboard Sharing
How might we make sharing data with leadership and stakeholders easier?
Data Quality
How might we more effectively validate the query results?
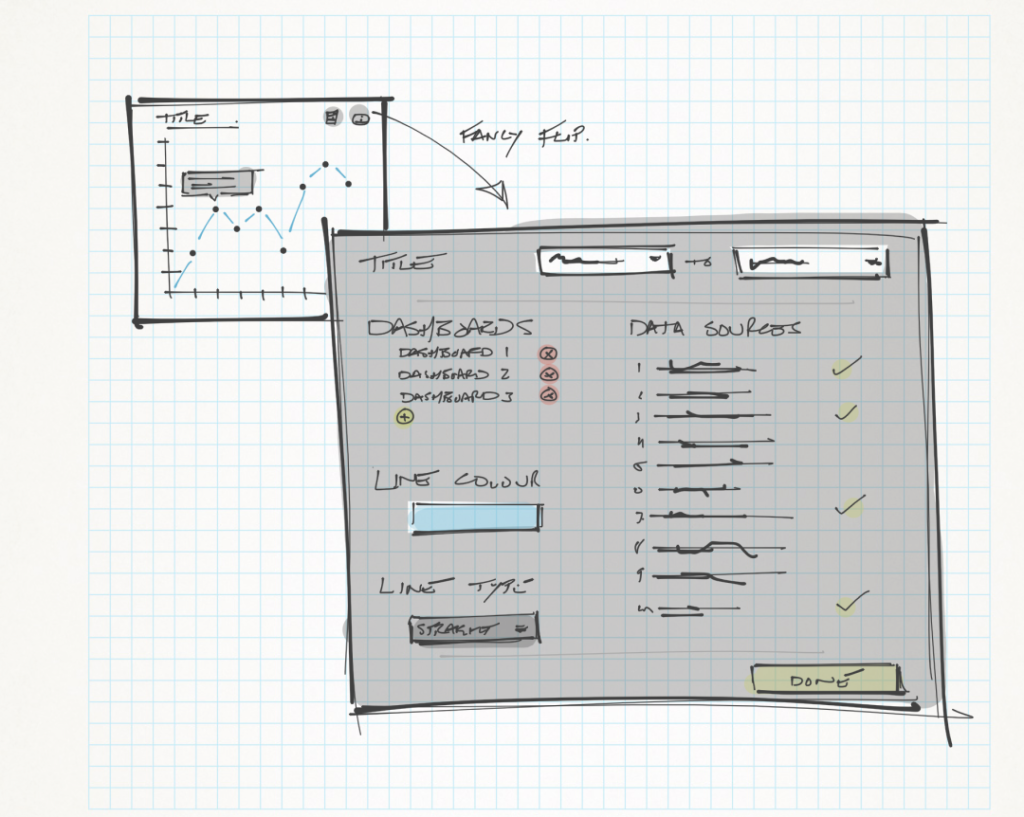
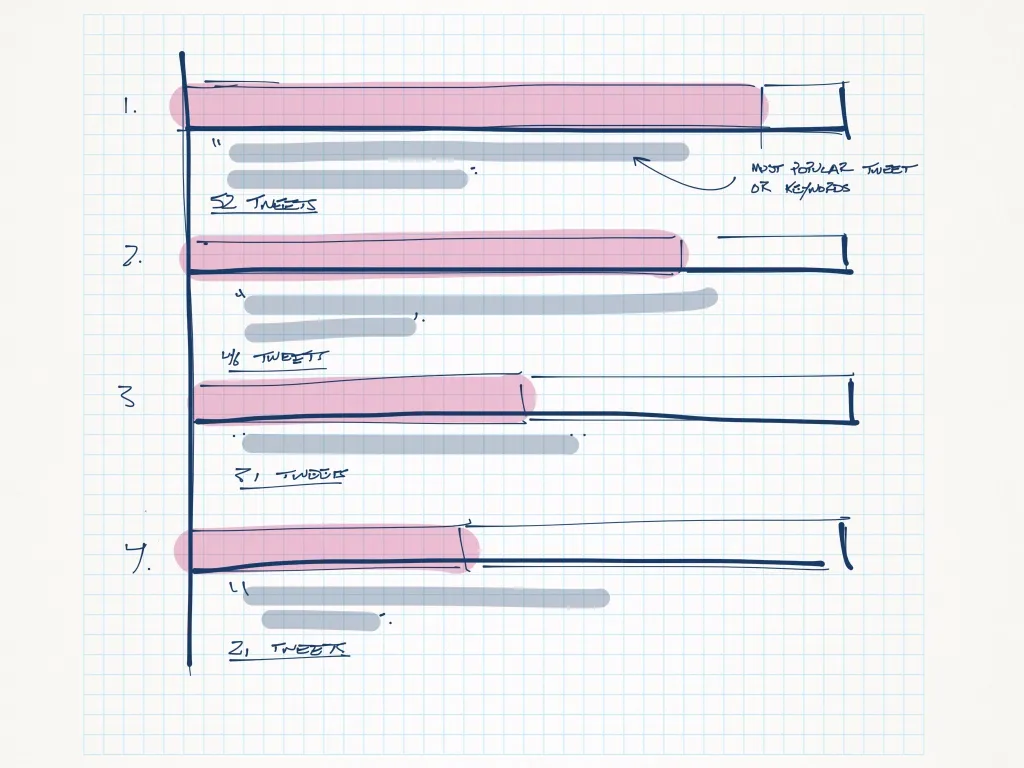
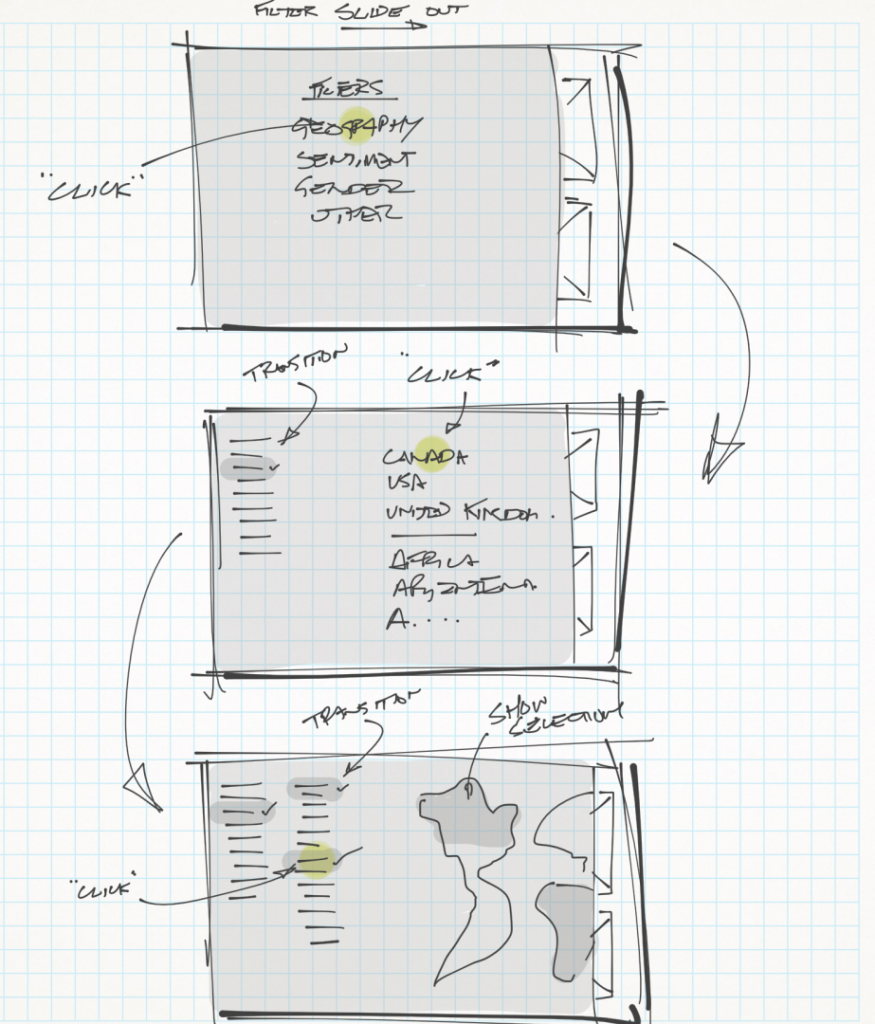
Concept Discovery Sketches

Key Learnings
Result Widget
Despite having results on a structured page, users also wanted a widget to show results as stakeholders would want to get a 'taste'.
Widget Library
While not meeting design intent exactly, we aligned that a widget library was needed to scale the product and deliver quickly.
Keep Users Close
Widget visualizations were key to customer success there was a steady stream of feedback. Understanding how and why they were used was ongoing.
Product Design
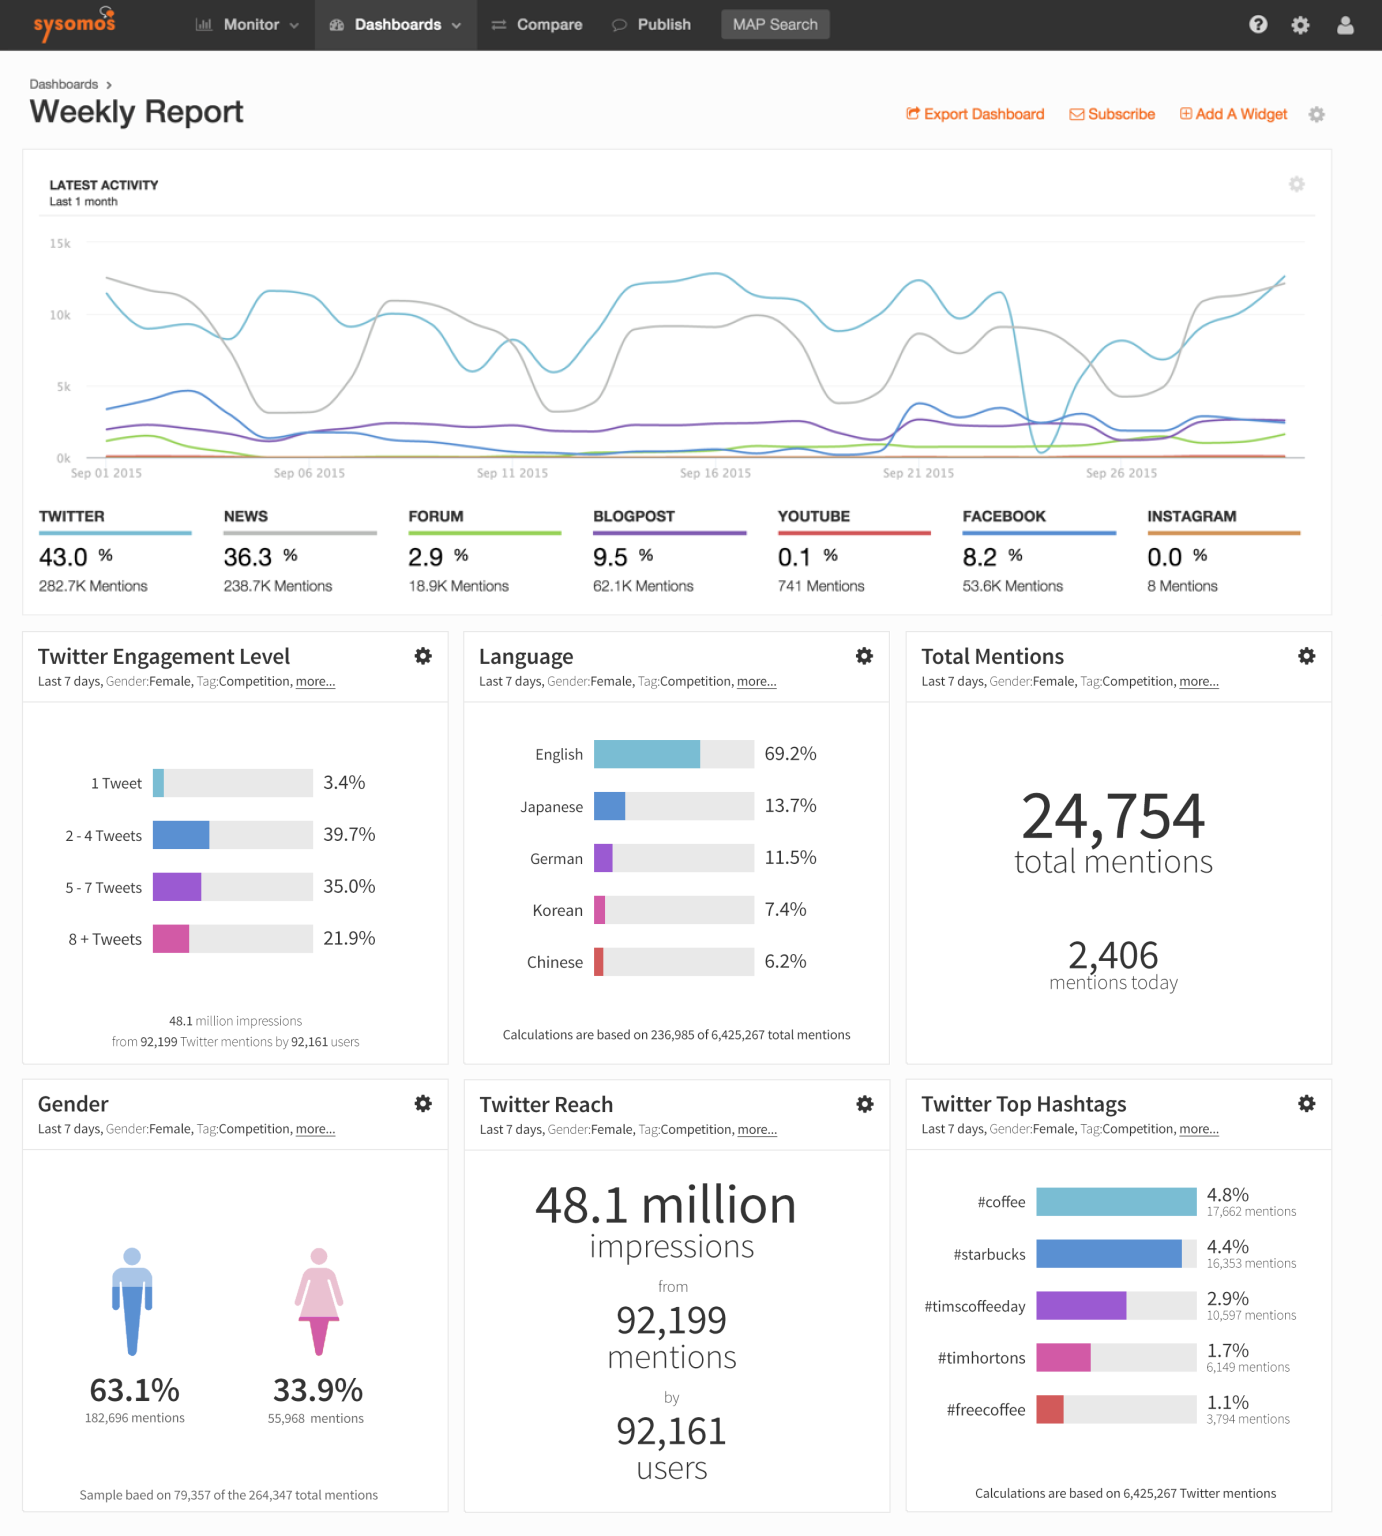
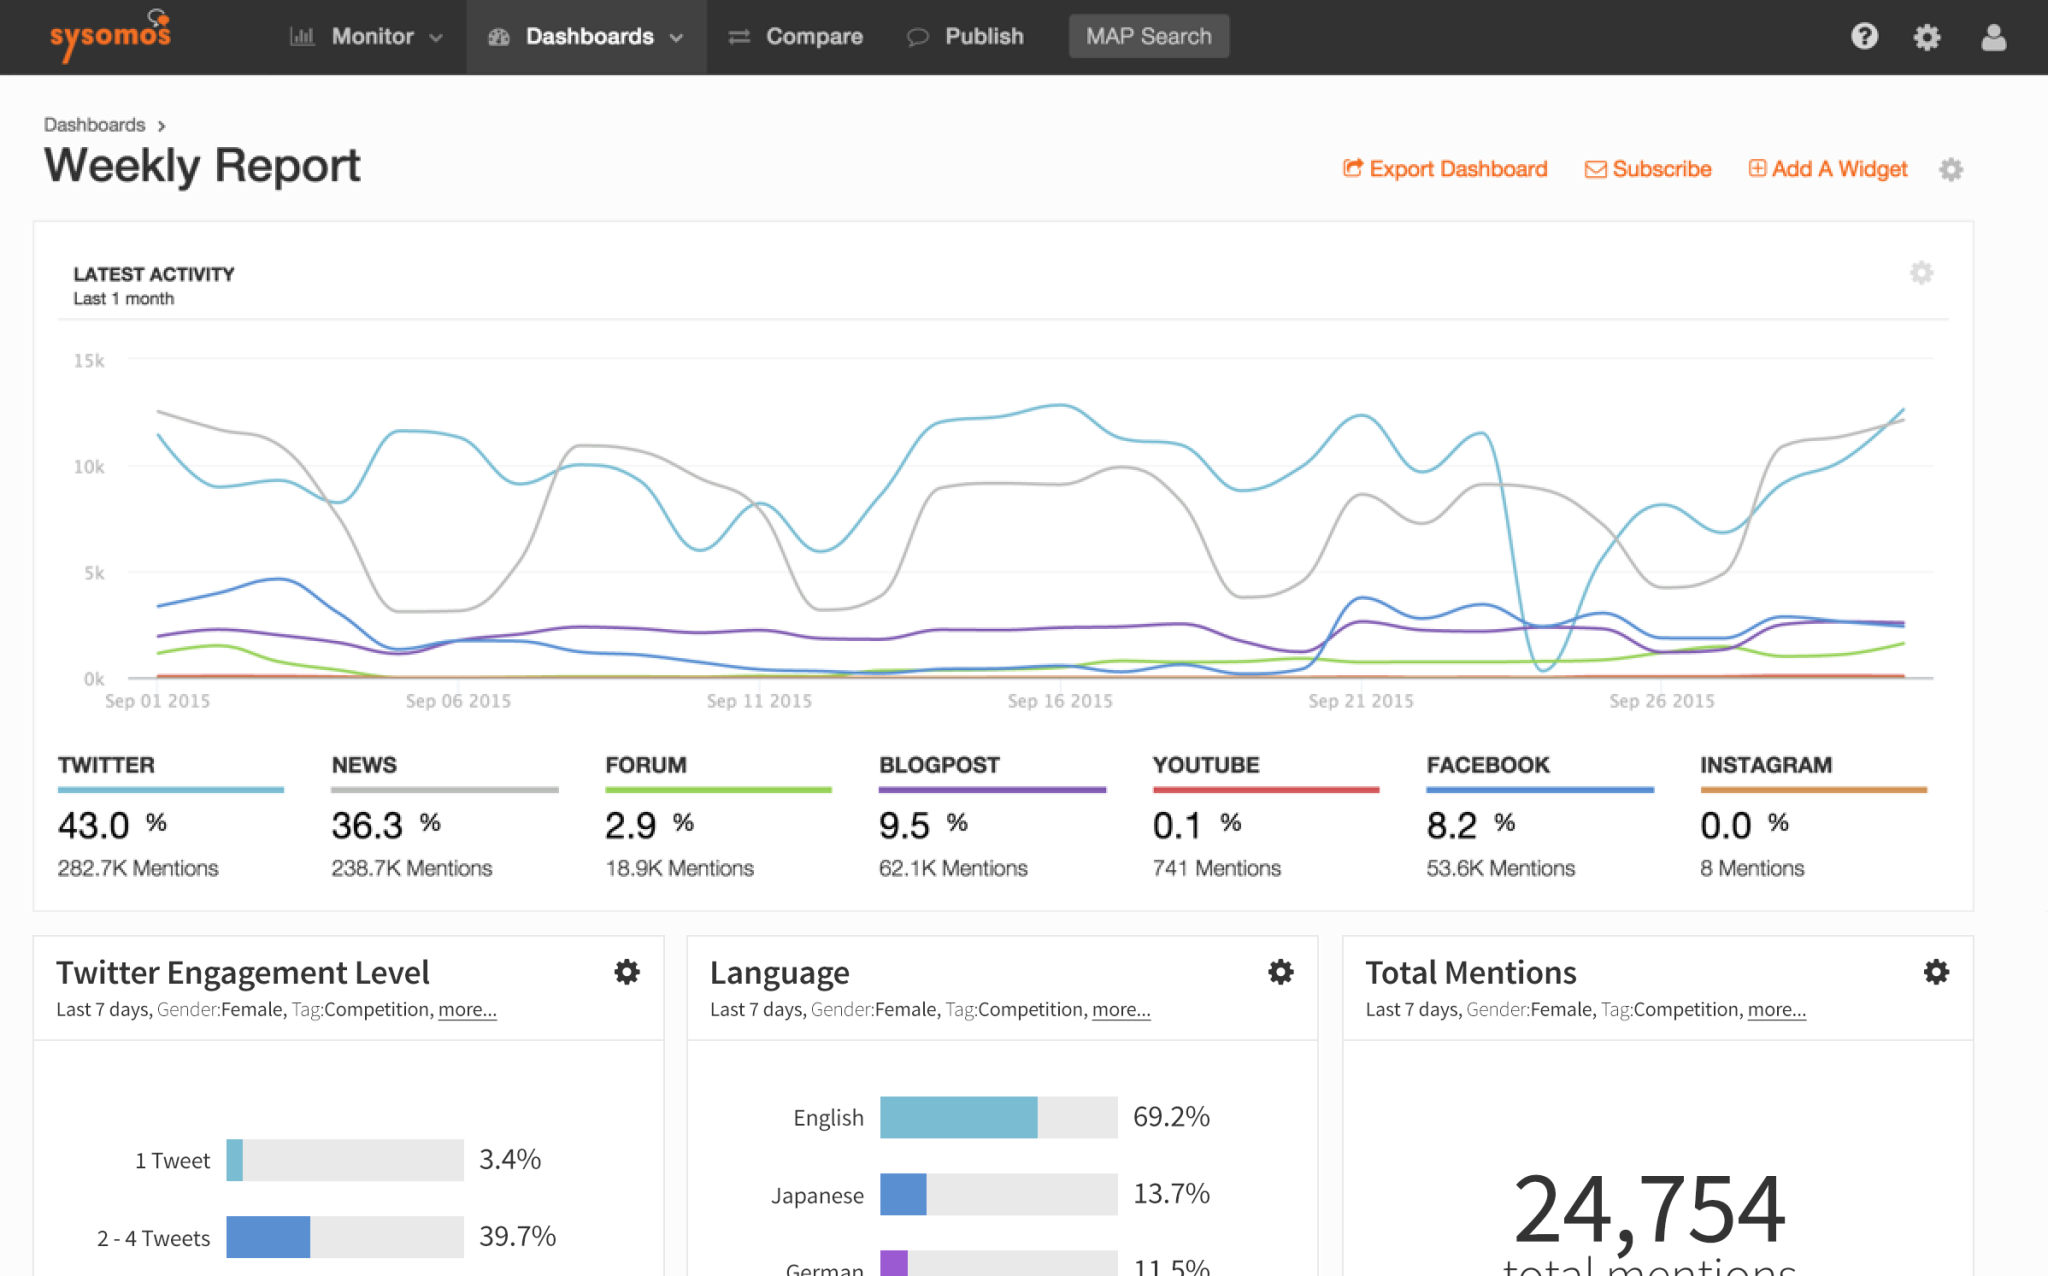
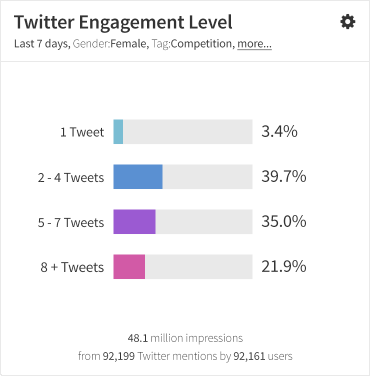
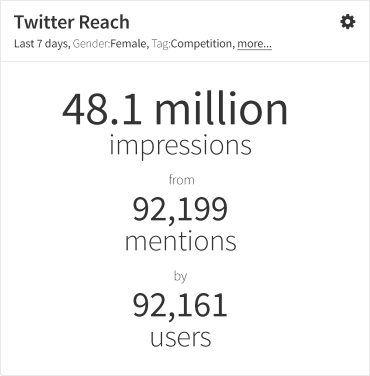
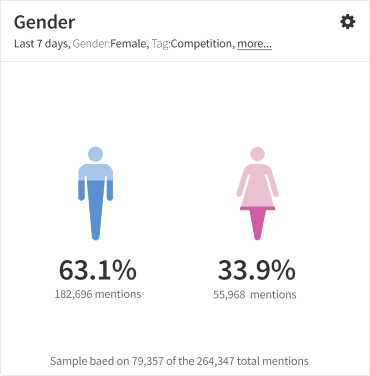
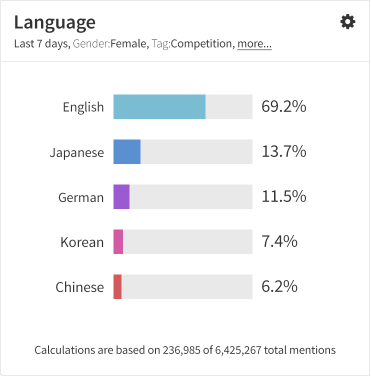
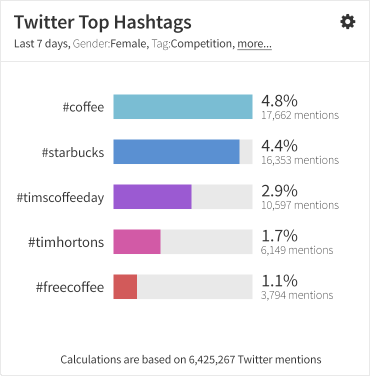
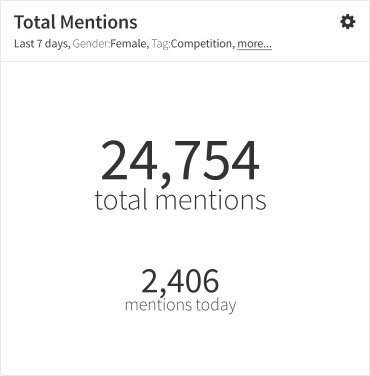
Moving forward, we aligned on a widget library and applied a consistent style and colour theme. Because there reports are often printed, we minimized the amount of dark and block colours. Widgets by default had 2 sizes, smal & large. This is a smal sample of the provided options.
Widget Key Learnings
Vertical Space
After product launch we noticed a high percentage of dashboards using small widgets. As an iteration we planned to reduce the visual height of widgets – especially large – in order to fit more content above the fold/on the first report page.
Filter Visibility
Early concepts did not clearly display filter details which received negative feedback. Consumers of the information needed to be aware of the data context. For printed reports the 'more...' was replaced with the full filter.
MAP & HEARTBEAT BROUGHT INTO A SINGLE PRODUCT OFFERING WITH SIMPLIFIED QUERY CONSTRUCTION AND IMPROVED SHARING.
